Our framework allows scientists to characterize the source of non-determinism in a
application without a priori knowledge of its communication patterns.
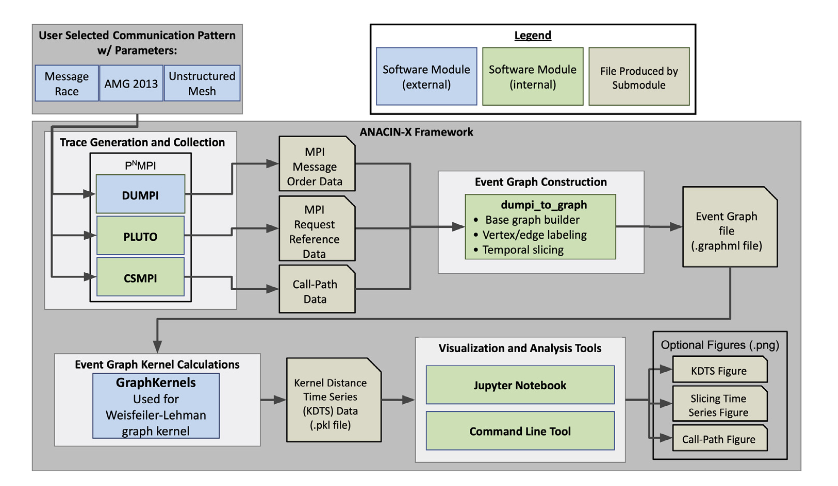
ANACIN-X is a suite of software modules for trace-based analysis of
non-deterministic behavior in MPI applications. The four core modules are as
follows:
Modules
Execution Trace Collection: A software module for trace generation
and collection of an application's executions.
Event Graph Construction: A software module for event
construction.
Event Graph Analysis: A software module for event graph kernel
calculation
Visualization: A software module for visualization and analysis of
kernel distance data.
MPI applications often run multiple times as ensembles of jobs; non-determinism (i.e.,
run-to-run variations in communication behavior across the ensemble) can be studied in
this context.
By running multiple executions of an application, users can improve the statistical
significance of their comparisons vis-a-vis non-determinism
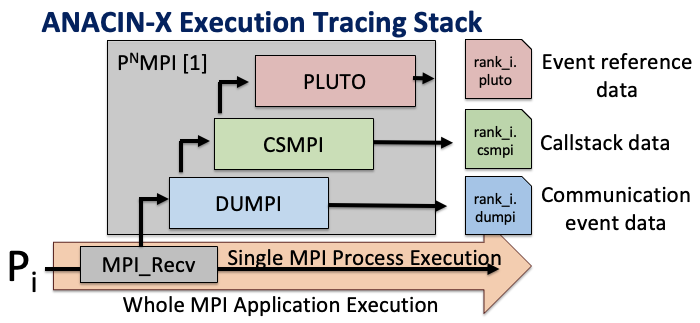
ANACIN- X quantifies and characterizes non-determinism in such applications by first
generating execution trace data via three tools, each of which depends on the MPI
Profiling Interface (PMPI) 1.
DUMPI: Traces MPI communication calls and their order from
the executions.
DUMPI2 tool was developed at
Sandia National Laboratories. ANACIN-X is using it according to its
software release license.
It generates one trace file per MPI process containing an unambiguous order of MPI
communication events involving
that process. At the same time, (SST) DUMPI imposes low overhead, and thus minimal
probe effect,
on the traced application.
Pluto: Collects memory addresses associated with those MPI
communication calls to supplement (SST) DUMPI’s traces
Pluto3 was developed by the
authors and traces memory addresses of MPI requests
associated with non-blocking MPI calls. ANACIN-X uses these memory addresses to
distinguish between different types of non-blocking MPI calls (one of the main
sources of non-determinism in MPI applications
CSMPI: Collects call-paths terminating in calls to MPI
functions.
CSMPI4 was also developed
by the authors and traces call-paths (i.e., sequences of
function calls beginning with the executable’s entry point) terminat- ing in calls
to MPI functions. In doing so, CSMPI associates runtime events (which may be
non-deterministic) with static information about program structure.
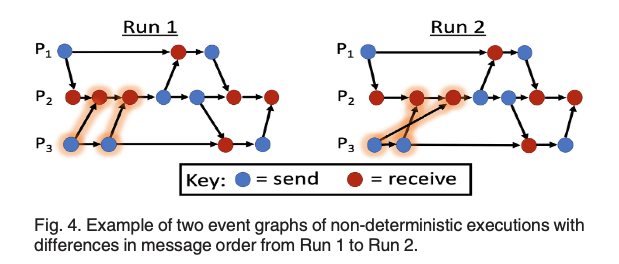
ANACIN-X uses the trace files to model the execution of non-deterministic application as
a directed acyclic graph. It feeds the (SST) DUMPI, Pluto, and CSMPI trace files into
the dumpi_to_graph
tool to generate a graph model, or ’event graph’, of each execution’s interprocess
communication.
The DAG represents point to point communication events (message send and receives) and
edges represents happens before relationship between the events
dumpi_to_graph
The dumpi_to_graph5
tool was developed by the authors to construct a directed acyclic graph (DAG)
representation of the order/interleaving of all MPI messages sent during the
execution to which the input traces correspond.
In practice, dumpi_to_graph 5
converts per-process trace data to graphs: one graph file is generated for each
execution. Figure above shows an example of event graph construction.
Event graph analysis module uses the created event graphs and quantify the difference
between each graph. This step introduces three key concepts:
WLST Graph Kernel Selection ANACIN-X utilizes the
Weisfeiler-Lehmann Subtree (WLST) 6 graph kernel
to quantify differences between event graphs. The choice of WLST is based on its
performance characteristics, with an asymptotic time complexity of complexity of
O(Nh), where N is the node count
in the largest input graph and h is the vertex label refinement iteration count.
Kernel Distance Time Series (KDTS) ANACIN-X provides an API for
defining a sliding window over pairs of graphs (corresponding to executions) to
compute pairwise kernel distances. This results in a Kernel Distance Time Series
(KDTS) which measures how differences in message orders between executions vary over
time. Low KDTS values indicate similar message orders, while high values indicate
dissimilarity.
Quantifiying Non-Determinism The collection of KDTSs obtained
from all pairs of executions in an ensemble provides a comprehensive view of an
application's non-determinism. These individual KDTSs are merged into a time series
of kernel distance distributions, effectively quantifying the non-deterministic
behavior of the entire ensemble of executions.
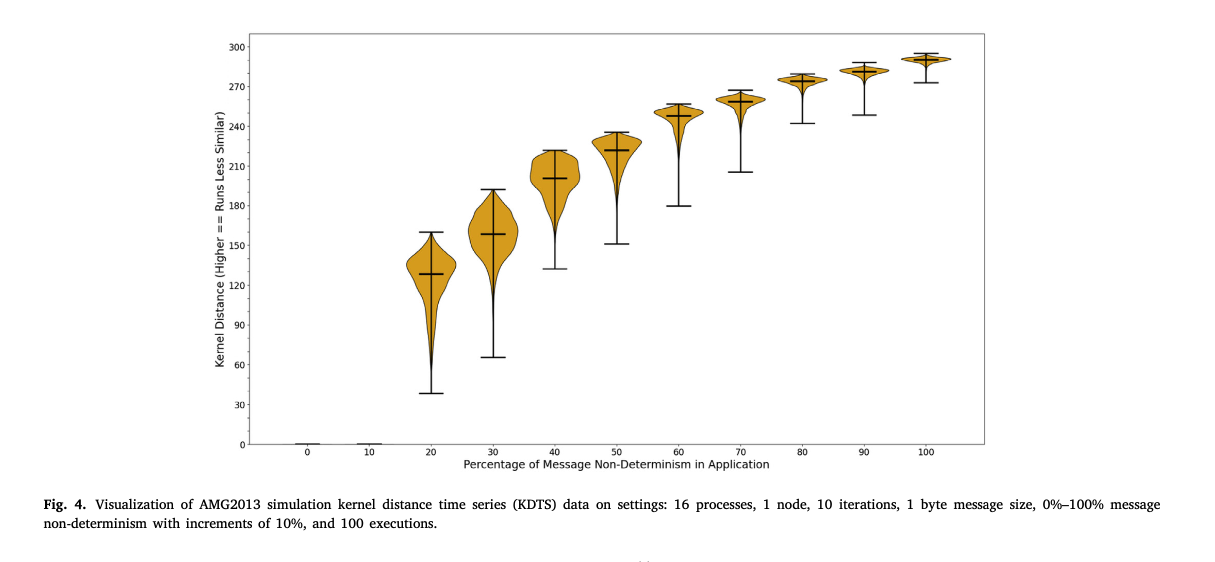
To view the relationship between kernel distance and non-determinism percentage (ND%) in
an application,
ANACIN-X supports two types of visualizations for a KDTS file:
A violin plot showing the distribution of pairwise kernel distances for multiple
configurations of the same application. (as shown infigure below)
A bar plot showing the relative frequency of call-paths in high-non-determinism
areas of execution.
These visualizations can be obtained via
Jupyter notebook, which guides the user through the visualization process and
displays each generated figure within it
A set of Python scripts implementing a command line interface, which allow users to
generate figures from the same place they submit jobs.